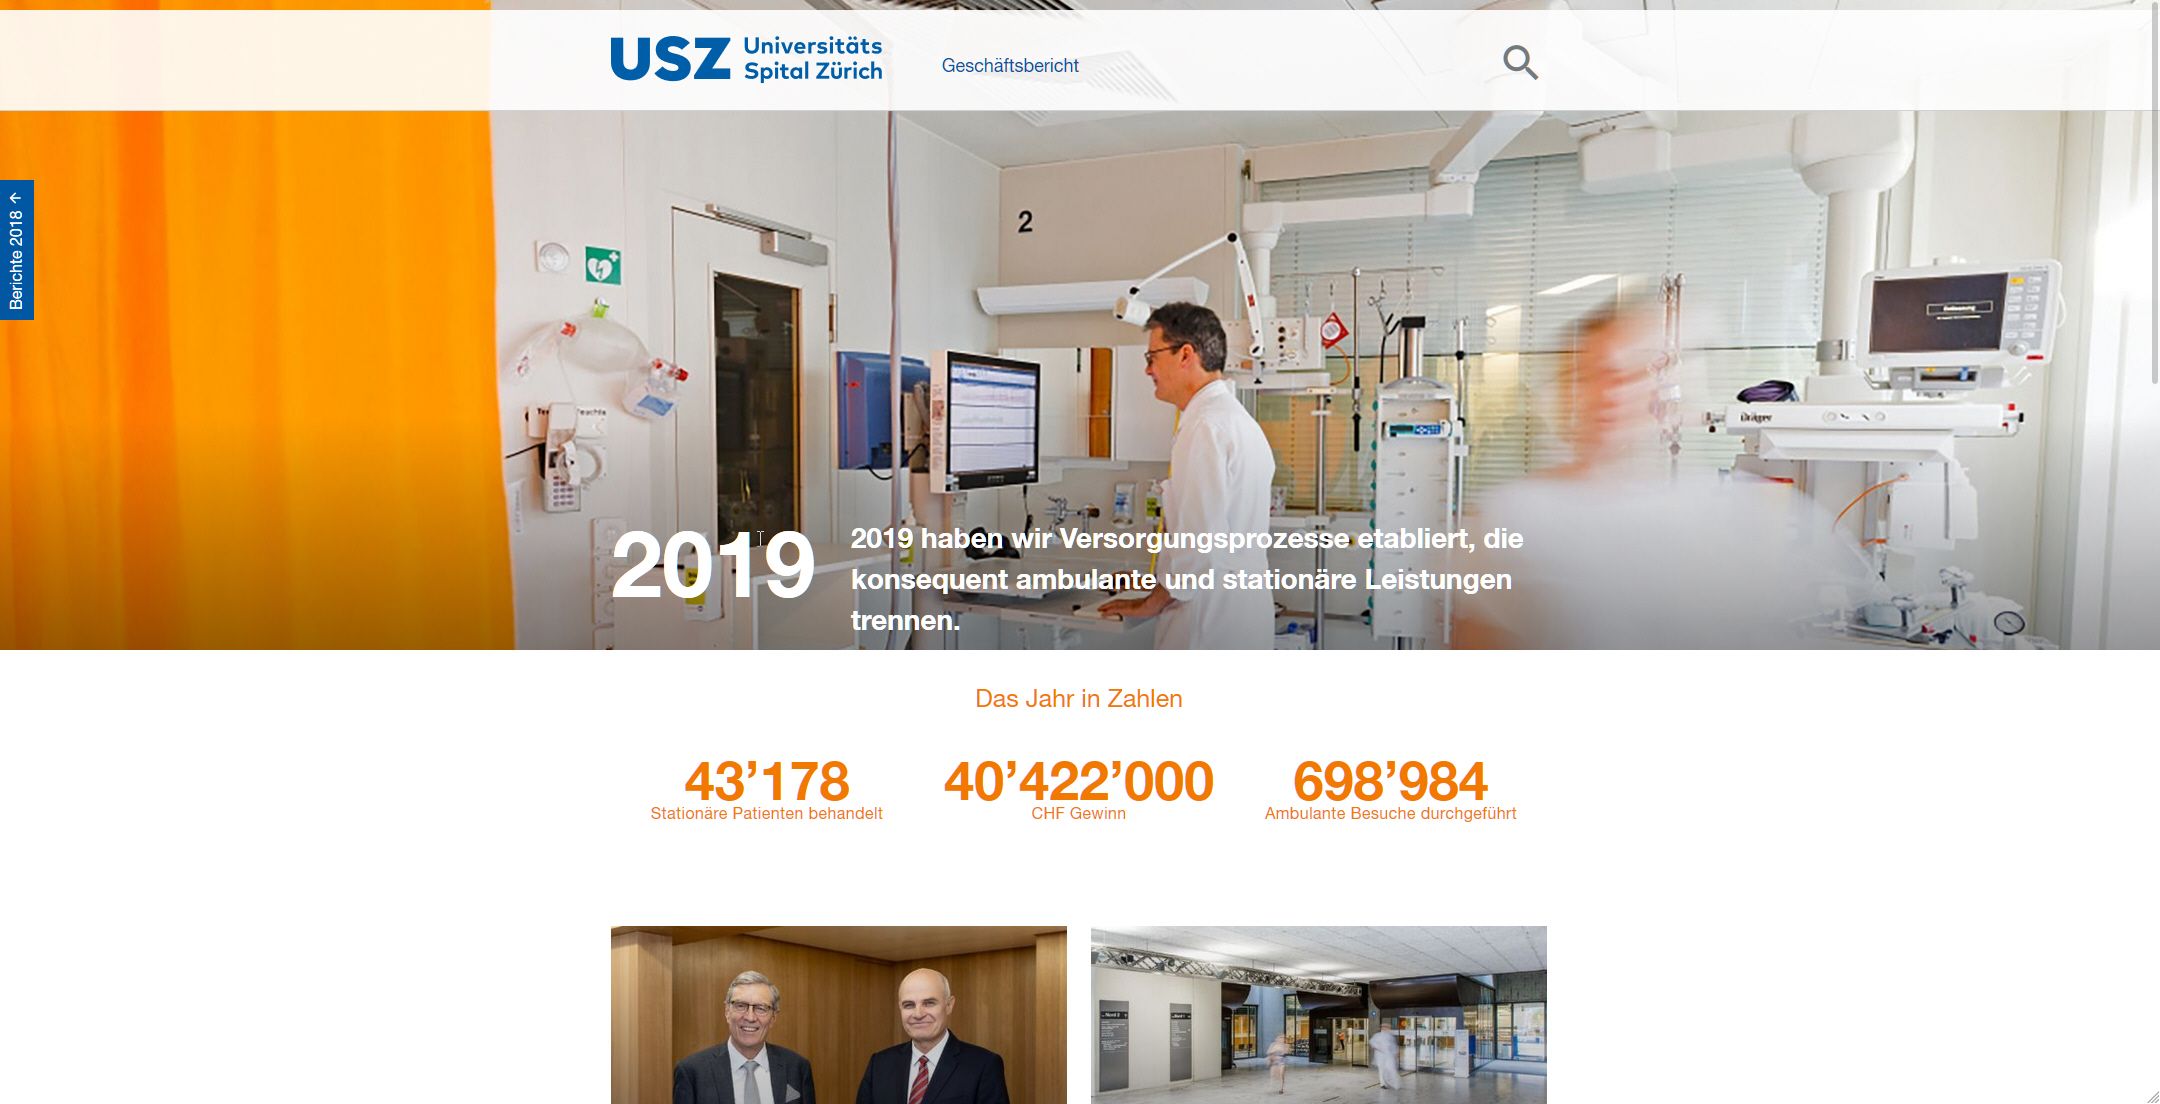
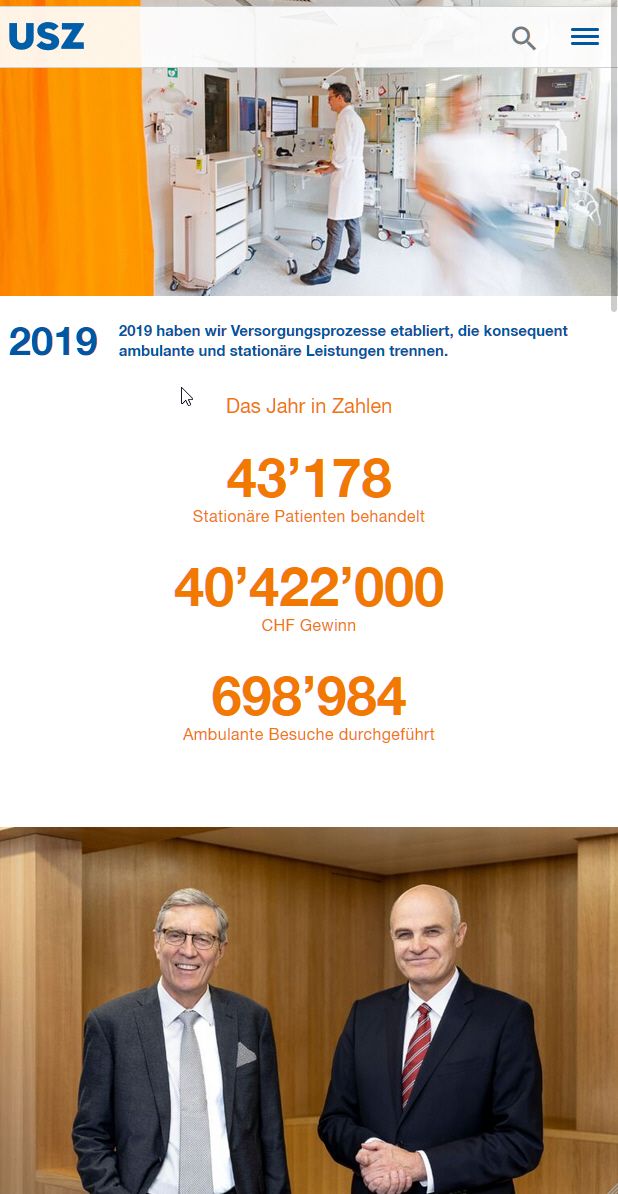
Online Annual Report for the University Hospital of Zurich


USZ Jahresbericht is the annual report of the Universitäts Spital Zürich. Each year the hospital makes its audit on finances, quality and research available to the public in various media, among them a presentation website which we had the pleasure of implementing together with LikeBerry.
- Content Management SystemWordPress
- FunctionalitiesModular Structure, Custom import tool
Dream Production Services
The first important requirement we had to fulfil was that of providing an enhanced yet structured and easy to navigate interface for content editors. Given the degree of flexibility expected from the CMS interface the implementation of a custom layout builder quickly emerged as the most efficient approach to providing a good experience for content management.
As a result, the USZ Jahresbericht website is built on a set of 20+ modules which are on one hand purpose-specific and on the other hand allow enough room for further configuration. The modular structure was also designed to handle edge cases in which several sets of modules can be grouped together and used as “modules within modules”.
The second challenge was that of finding a simple way to integrate a massive amount of data that came in the form of excel sheets. Furthermore, some of this data then had to be rendered either as tables, charts or graphs, according to the information it was illustrating.
Our approach was that of implementing two types of importers: one that would output tables and one that would output charts and graphs. Although we still refer to them as importers, these tools actually handle the import, configuration and display options for table, graphs and charts.
The custom table importer we ended up building was based on a series of iterations that helped in gradually outlining features ranging from simple style configuration for each table line to the drag and drop interface used to map the mobile table teasers. In its final version, the table importer handles .csv and .xls/.xlsx input files and maps them on a WYSIWYG interface content editors can style by just clicking around. All this without them having to worry about altering the original excel data, in case they don’t want to do that.
A second importer based on the Google Charts API, was implemented and customized to tackle the creation of charts and graphs using the same file types as input. Although different than that of the table importer, this interface included all the configuration options editors would need to assign a specific style and format for a chart or a graph.
The third important expectation we had to meet was the implementation of a pixel-perfect website interface that had to comply to the level of rigour USZ stands by in all aspects of the institution’s life. Having launched the website without a need to reimplement the frontend, we believe that no further details are in order here aside from the USZ Jahresbericht website link.
Bringing the large amount of physical data into the online medium was no easy feat, but the USZ Jahresbericht is a perfect example of the type of results we can achieve with custom built solutions. If you need to design and implement a proper way to showcase data online, give us a call and we’ll tell you everything there is to know about it.


